

Trends Per GF Data 1
By the end of the fourth quarter of 2024, private equity (PE)-backed deal volume “went out with a whimper,” according to GF Data. Per GF Data’s database, 94 deals were recorded in the 4th quarter of 2024, a slight increase from the 82 completed transactions in the third quarter. For the full-year, GF Data recorded 379 completed transactions, this is compared to just 294 completed transactions in 2023. The aforementioned data has been pulled from 432 participating private equity firms who have provided transaction information to GF Data since 2003.
One of the most common valuation multiples is TEV/EBITDA. TEV is an acronym for total enterprise value. EBITDA is an acronym for earnings before interest, taxes, depreciation, and amortization, and is also a proxy for operating cash flow. GF Data provides transaction statistics on private equity-sponsored M&A transactions with deal values ranging from $10 to $500 million. A summary of TEV/EBITDA multiples by TEV is detailed in the table below.
TEV/EBITDA Multiples by Quarter
| TEV (in millions) | Q1 2023 | Q2 2023 | Q3 2023 | Q4 2023 | Q1 2024 | Q2 2024 | Q3 2024 | Q4 2024 |
|---|---|---|---|---|---|---|---|---|
| $10-$25 | 6.4 | 5.4 | 5.9 | 6.2 | 6.3 | 6.5 | 6.4 | 6.6 |
| $25-$50 | 7.2 | 6.9 | 6.8 | 7.1 | 6.0 | 7.0 | 7.0 | 7.1 |
| $50-$100 | 7.9 | 8.0 | 8.7 | 7.6 | 7.9 | 8.7 | 8.9 | 7.5 |
| $100-$250 | 9.5 | 8.5 | 10.0 | 9.9 | 8.8 | 7.9 | 7.8 | 9.2 |
| $250-$500 | 12.2 | 9.0 | 14.8 | 9.6 | 8.7 | 10.8 | 8.9 | 12.1 |
| Total | 7.6 | 6.8 | 7.3 | 7.3 | 6.8 | 7.4 | 7.2 | 7.3 |
As noted above, multiples have fluctuated over the past eight quarters, particularly based upon a company’s total enterprise value. Further, GF Data notes the following in relation to the above 2024 multiples:
- More financially strong businesses traded in the third and fourth quarters as compared to the first and second quarters.
- The average difference between Above-Average Financial Performing (“AAFP”) companies and non-AAFP companies increased in the second half of 2024.
- Add-on investments (whereby a PE firm acquires a company to incorporate it into an already existing portfolio) accounted for a larger portion of deal activity in 2024. The peak was in the first and second quarters; however, platform investing (which is an initial investment made by a PE firm to establish a portfolio for future add-on investments) was more prevalent in the second two quarters.
- Manufacturing valuations improved in the fourth quarter.
Trends Per DealStats 2
According to DealStats, which generally tracks transaction data from private company “Main Street” business transactions from business brokers (i.e., typically smaller companies), EBITDA multiples increased in the fourth quarter of 2024. However, this increase is in comparison to the third quarter of 2024. The multiples experienced in the third and fourth quarters have generally been below those of the prior quarters. Selling price/EBITDA multiples since the first quarter of 2019 are presented in the below chart.
Median Selling Price/EBITDA with Trailing Three-Quarter Average (Private Targets)
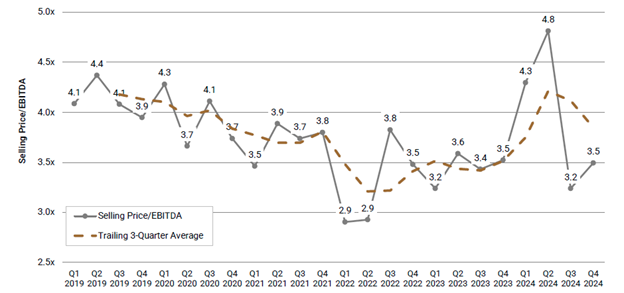
Generally, the greater the TEV, the greater the multiple. Therefore, it would be expected that the multiples presented in DealStats would be less than those presented in GF Data due to the size differences of the companies analyzed (multiples could also be expected to differ slightly as DealStats utilized selling price in the numerator, whereas GF Data utilizes total enterprise value).
Conclusion
Transaction activity and related deal multiples can vary greatly depending on the size of the business, profitability, growth expectations, economic and industry conditions, and interest rates. Therefore, it would be inappropriate to simply apply these multiples to a company without consideration of the facts and circumstances of that specific company.
We provide merger and acquisition services to many clients, including private equity and institutional investors. Our Private Equity and Institutional Investors team is actively involved with various organizations and resources to stay current with changes in the market. Learn more about our service offerings and meet our team.
Sources:
[1] GF Data M&A Report – February 2025. Conshohocken, PA: GF Data Resources LLC, 2025.
[2] DealStats Value Index Digest – Q1 2025. Portland, OR: Business Valuation Resources, LLC, 2021
About the Author

Jack Schornhorst, Valuation and Forensic Services Senior Associate, performs business valuations for the purposes of mergers and acquisitions; estate, gift, and income taxes; litigation and shareholder disputes; employee stock ownership plans; reorganizations; marital dissolution; buy/sell agreements; business planning; and financial reporting. Jack also assists with forensic accounting investigations including corporate frauds and employee embezzlements. In addition, he performs litigation consulting services including damages and lost profits calculations.
He has served clients in a variety of industries including, but not limited to technology, financial, construction, healthcare, retail trade, manufacturing, distribution, wholesale, government contracting, and professional services.
The information contained within this article is provided for informational purposes only and is current as of the date published. Online readers are advised not to act upon this information without seeking the service of a professional accountant, as this article is not a substitute for obtaining accounting, tax, or financial advice from a professional accountant.